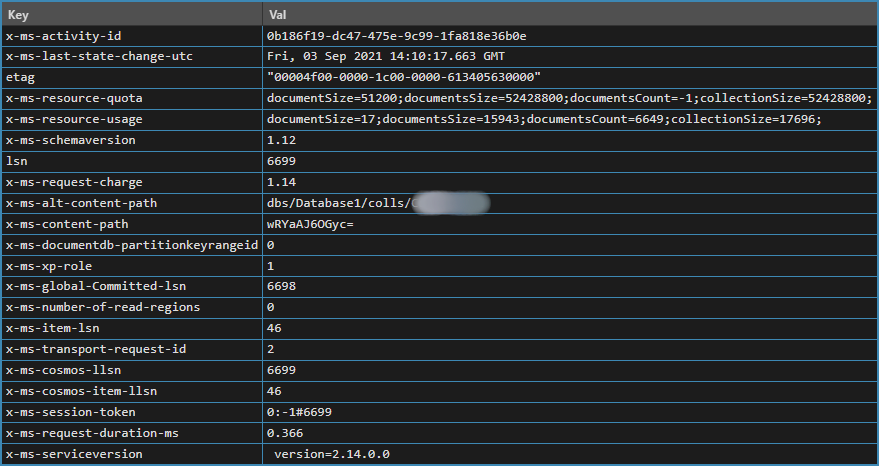
This post replaces an earlier one titled Catch Cosmos Client Statistics where I briefly explained how you can use a request handler to intercept statistics about each database query. The statistics include the Request Units (RUs) expended by each query, which is correlated to the actual cost of running the database.
A request handler class is provided with more information that I realised a couple of weeks ago. You can fully reconstruct each query and retrieve matching statistics such as RUs, elapsed time, database size and record count. All of this information can be combined to create concise logging output which can help you pinpoint performance bottlenecks or expensive queries.
Construct a CosmosClientBuilder class with the endpoint and key to the Cosmos account. Use AddCustomHandlers to add an instance of a class derived from RequestHandler. Override SendAsync and extract the following information:
request.ActivityId (a Guid string)
request.Method
request.RequestUri
request.Content (see note #1 below)
request.Headers.ContinuationToken
response.Headers["x-ms-request-charge"]
response.Headers["x-ms-resource-usage"] (see note #2 below)
Note #1 - Content
The Content Stream is null for GET requests which are generated by simple read-by-id queries, but is present for POST requests generated by more complex queries. I found the Content to actually be a MemoryStream containing the full query text. It can be extracted like this:
byte[] buff = new byte[request.Content.length]
request.Content.Read(buff, 0, buff.Length);
string query = Encoding.UTF8.GetString(buff);
Note #2 - Usage
The database usage information is unfortunately embedded in a joined string of key=value pairs, but an easy way of extract the values is like this:
  string s = response.Headers["x-ms-resource-usage"];
  Match m = Regex.Match(s, @"documentsCount=(\d+)");
  int docCount = int.Parse(m.Groups[1].Value);
Take care when referencing the Header collection values, as the keys present in different requests are a little bit unpredictable. It's safest to use Headers.TryGetValue("key").
While experimenting with this code in my own hobby suite called Hoarder, it revealed subtle bugs which were causing bursts of duplicate queries. One bug was a race from different places to read some important records which were supposed to be cached, but multiple reads were running before any value was cached. It's interesting to watch the raw database query activity as your app runs. Bugs and performance problems can be quickly identified.
At one point I saw a set of 6 duplicate queries and I thought it was a bug. It turns out my query was over all records, and what I was seeing was one initial query followed by 5 continuation queries. The request.Headers.Continuation token value tells you if a continuation query is running.
You can aggregate the useful information I've mentioned above and send it back to parent apps via a callback, or send it to your preferred logging library.
Addendum: When the handler is hosted in a web app live in Azure I found that the request.Header.ActivityId was sometimes null and other information was missing. I think it's safe to just skip logging in these cases, as an identical request will occur soon after with all the expected data available.

