Wednesday, August 30, 2017

Visual Studio 2017 Web Debug Start Page

After upgrading to Visual Studio 2017 I found that the start page of ASP.NET projects would popup the message like the following.


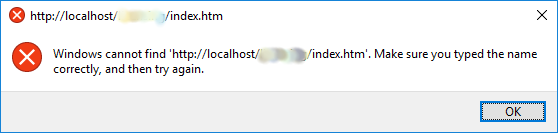
It had nothing to do with file or pool permissions, or what account your were debugging under, or what sort of ASP.NET project it was, or anything else I could discover. Strangely enough, after clicking OK the debugging actually started (without a UI), so luckily I could temporarily ignore the problem and continue developing my web services.

After a couple of weeks this problem became so irritating that I had to have a fresh look to defeat it. By luck, or a hunch, or desperation, or who knows what ... in solution explorer I right-clicked the index.htm file and selected "Browse With ..." and a small dialog appears. In the dialog I notice that the selected item in the Browsers list is Microsoft Edge (Default).


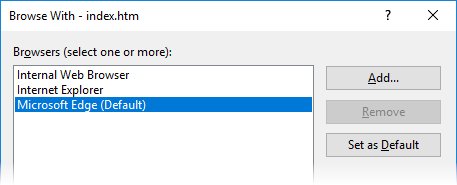
Changing the default to Internet Explorer solves the problem.

So here we are again ... despite my decades of wide IT experience, it takes me hours of puzzling and frustration spread out over many weeks to defeat a problem that has a trivial fix. Extensive web searches on this problem revealed no useful hints whatsoever.

IMPORTANT NOTE (a few days later)
A regular correspondent in the ozdotnet forum pointed out to me that your choice of default browser is easily visible in the Visual Studio Standard Toolbar ... if you have it visible. I personally hide all toolbars on Visual Studio and most other products that I use regularly, because I have of course memorised all of the keyboard shortcuts and prefer not to waste space and visual clutter on toolbars. Sadly, in this case, being a smartarse backfired and prevented me from quickly noticing the underlying cause of the problem.

Predictably, a short comical exchange resulted in the forum around the claim that "real programmers don't use toolbars".

Tuesday, August 22, 2017

log4net UDP Listener

There are lots of articles online about how to write a UDP listener client for logging broadcasts from the log4net UdpAppender. Unfortunately, most of them use localhost, or hard-coded addresses and port numbers and are misleadingly trivial and not good guidance for realistic use.

In my realistic scenario there are dozens of applications of various types running on two servers in an office network, and all the log4net sections of the config files specify:

<remoteAddress value="224.9.9.9"/>
<remotePort value="9999"/>

The address 224.9.9.9 is in the global multicast address scope so anyone within the broadcast horizon can listen-in.

But exactly how can a .NET listener client application somewhere on the local network listen to the logging broadcasts from the server machines? I fumbled around for a while getting no broadcasts because I didn't realise you had to "join" the multicast group. When I saw the JoinMulticastGroup method in the MSDN documentation I suddenly uncovered the missing link to make my C# code work. In skeleton form the required code is like the following.

var ep = new IPEndPoint(IPAddress.Any, 9999);
var client = new UdpClient(ep);
client.JoinMulticastGroup(IPAddress.Parse("224.9.9.9"));
while(true)
{
  UdpReceiveResult result = await client.ReceiveAsync();
}

Put the ReceiveAsync in a loop that suits your coding style. There is no elegant way to detect when a client is closed to end your loop. Some part of your code will call client.Close() and the await in the loop will throw an ObjectDisposedException. As far as I can tell, catching that specific Exception and breaking out of the loop is the neatest thing you can do.